Feature · Charts
The agent writes numbers.
The page draws them.
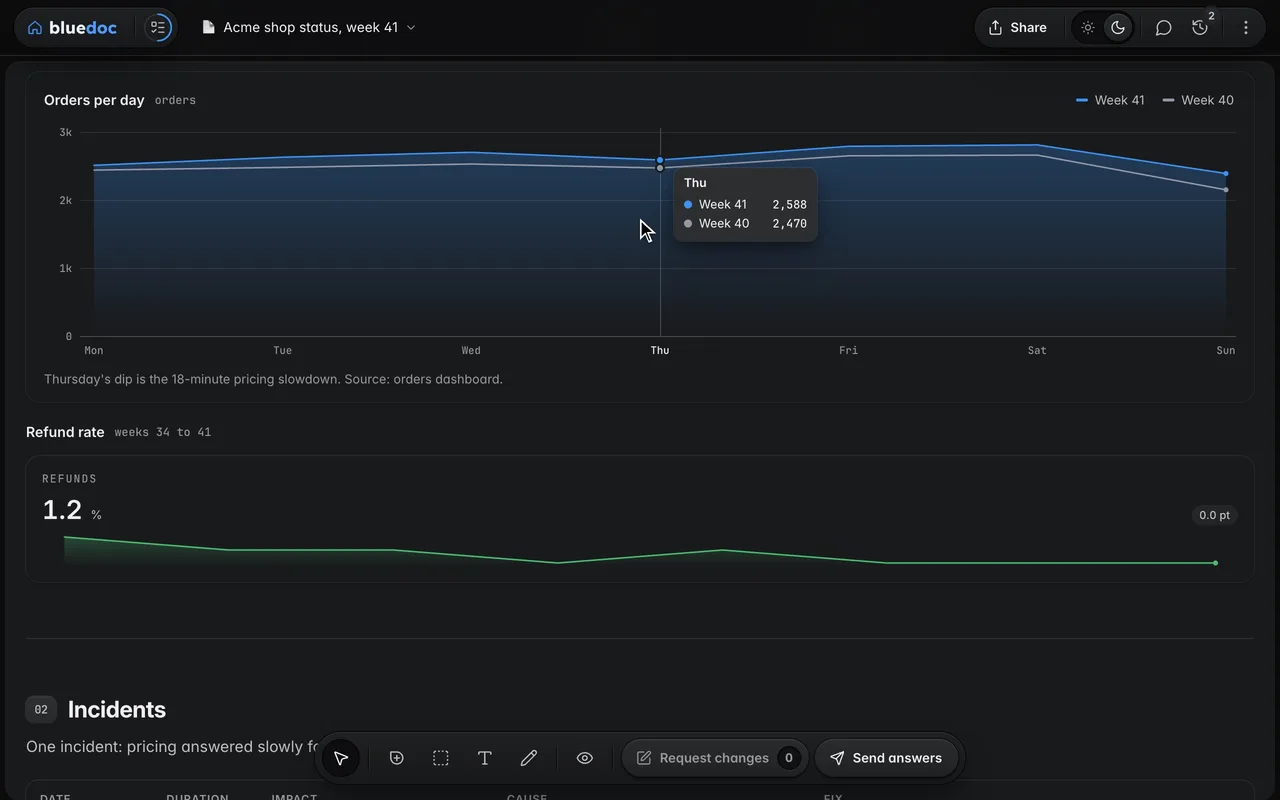
A chart is a block of numbers in the doc, never an image. The page draws it in light and dark, with the values on hover, and the next revision marks the ones that moved.
claude plugin marketplace add andreiverdes/bluedocclaude plugin install bluedoc@bluedocInside a session the same commands are /plugin marketplace add andreiverdes/bluedoc and /plugin install bluedoc@bluedoc. Start a new session to load the skill.
codex plugin marketplace add andreiverdes/bluedoccodex plugin add bluedoc@bluedocRestart Codex. Mention the skill with $bluedoc or let Codex pick it from your request. Plan mode (/plan) opens the plan as a page; the README has the sandbox lines that skip the approval prompts.
pi install git:github.com/andreiverdes/bluedocRestart pi. /bluedoc-plan-mode turns on plan mode, and the plan opens as a page for your approval.
omp plugin marketplace add andreiverdes/bluedocomp plugin install bluedoc@bluedocRun /reload-plugins in an open session, or start a new one. omp’s plan reviews open as pages: Approve runs the plan, Request changes refines it.
copilot plugin install andreiverdes/bluedocStart a new session. When Copilot leaves plan mode, its plan opens as a page and waits for your approval.
git clone https://github.com/andreiverdes/bluedoc.gitagy plugin install bluedoc/antigravityRestart agy. In plan mode (agy --mode plan or /plan), the implementation plan opens as a page for your approval.
npx skills add andreiverdes/bluedocFor any other agent that reads skills. Or clone the repository and link skills/bluedoc into your agent’s skills folder.
Status pages
The answer first, then the numbers.
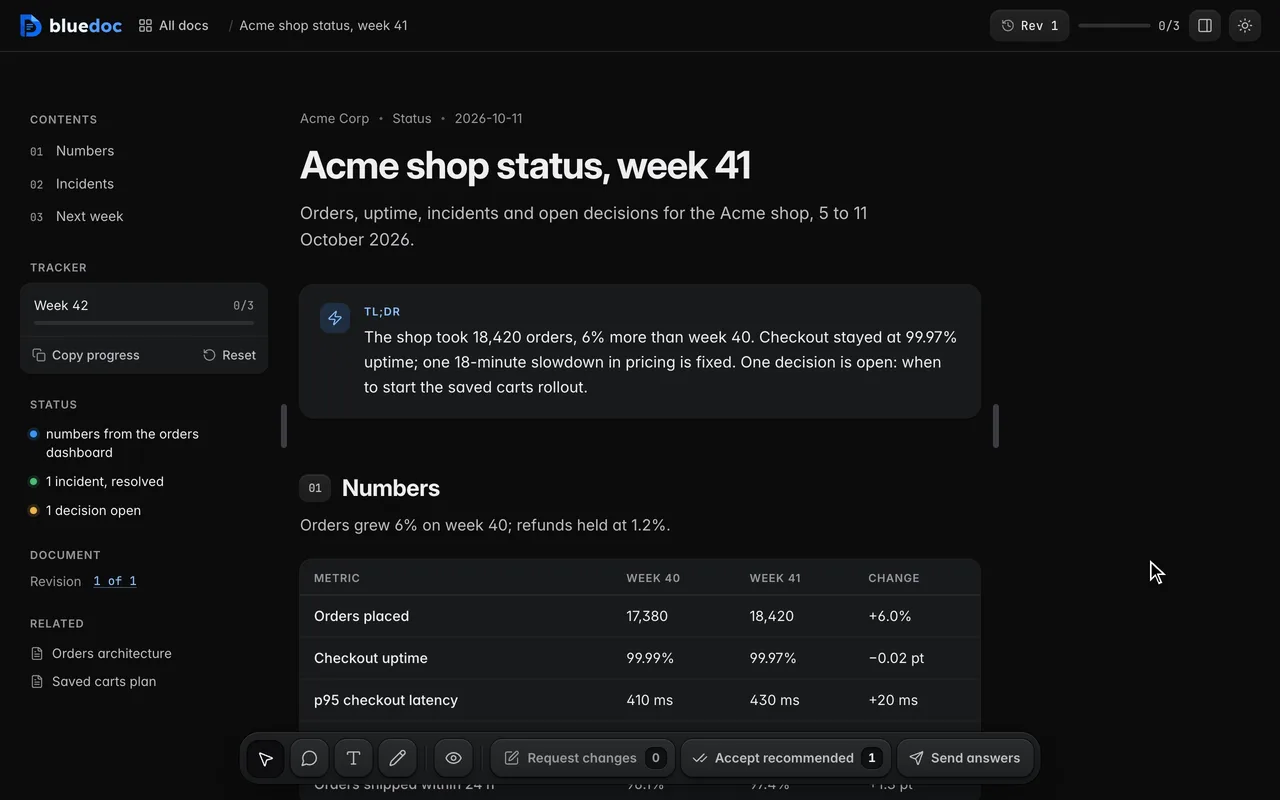
A status page opens on one number and its TL;DR, then the numbers with a chart. The home page shows that number on the doc’s card.
Read a weekly status page
The TL;DR states the answer, then one section per question the reader brings: the numbers with a chart, the incident, next week’s decision.
Spot the hero stat on the home card
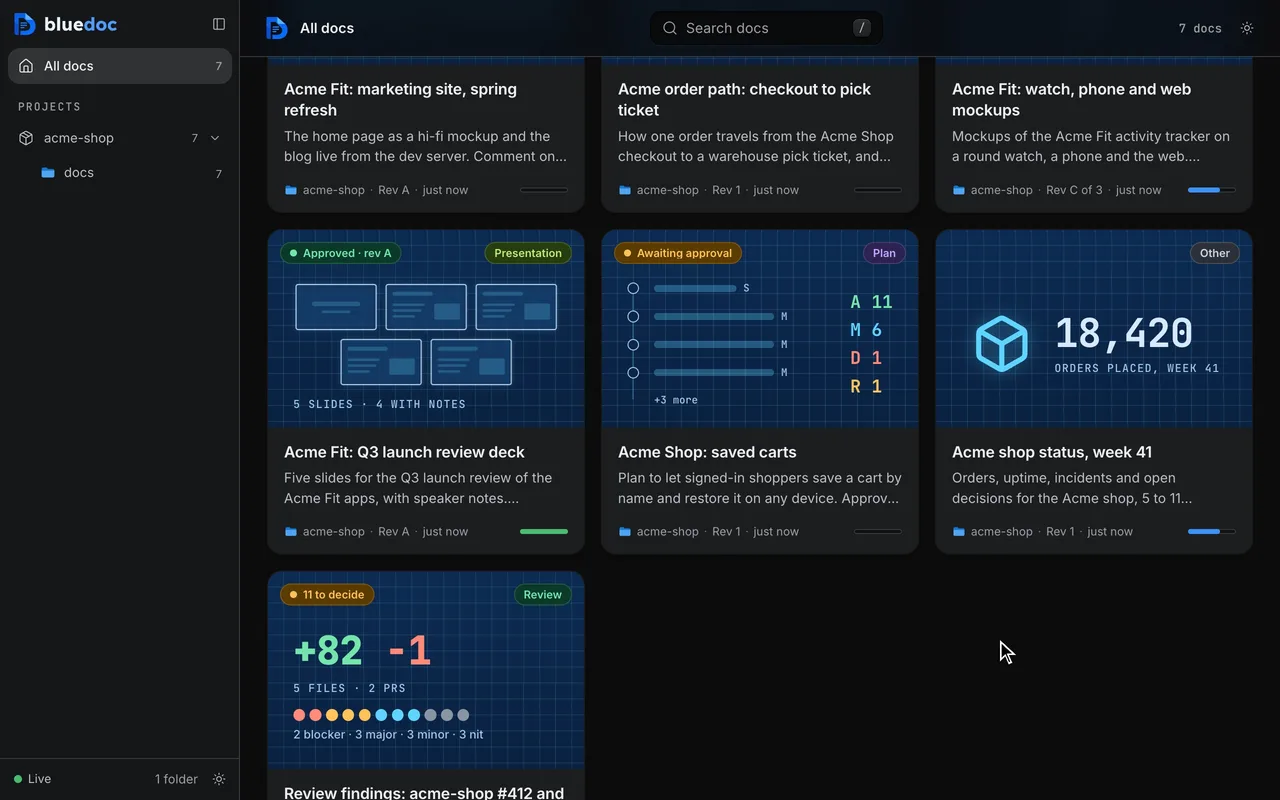
One number sums the page up, with an icon and a label. The home page shows it on the doc’s card.
Read the statistics
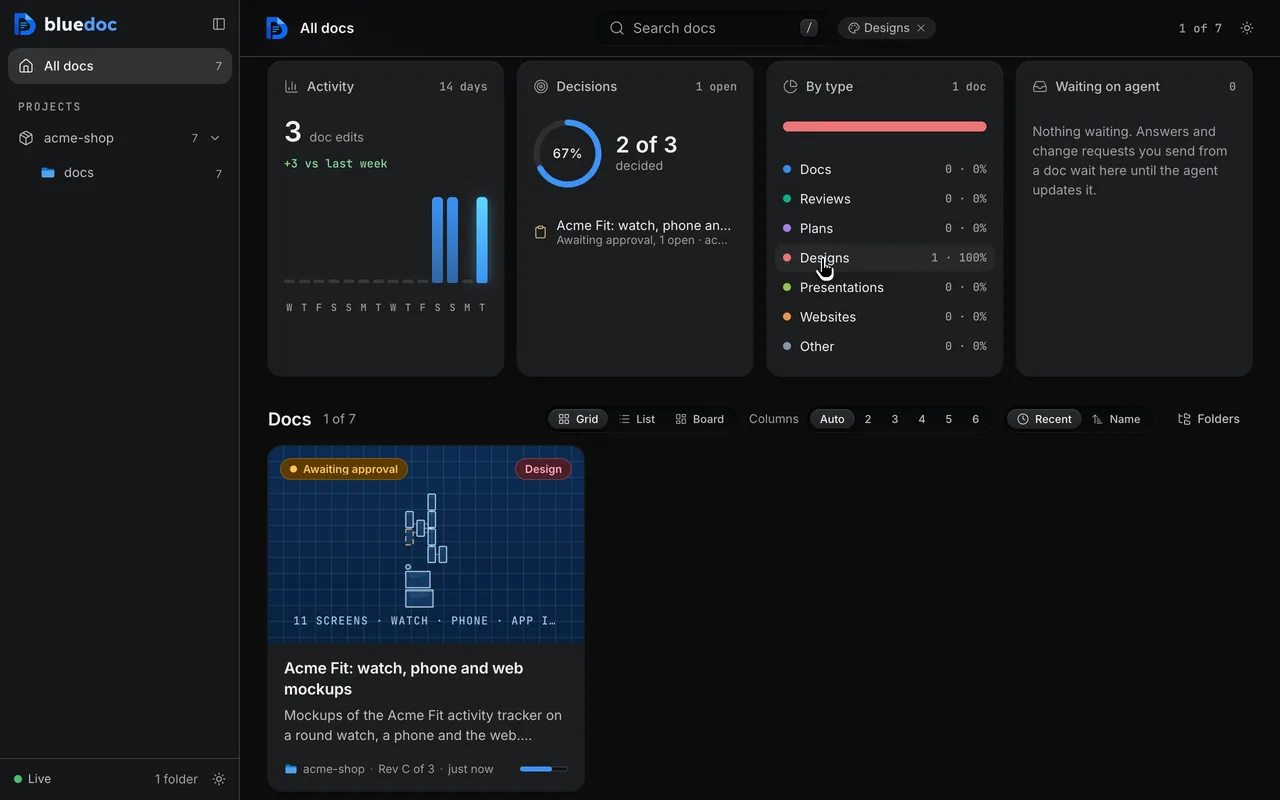
Statistics shows activity, decisions, docs by type, what waits on the agent, edits by project and the oldest open decisions, for one project or all, over 7, 14, 30 or 90 days.
Week after week
Ask about a number. Compare next week.
Box a table with Pen and the agent gets the part’s key. Next week’s update is a new revision of the same page, and compare marks what moved.
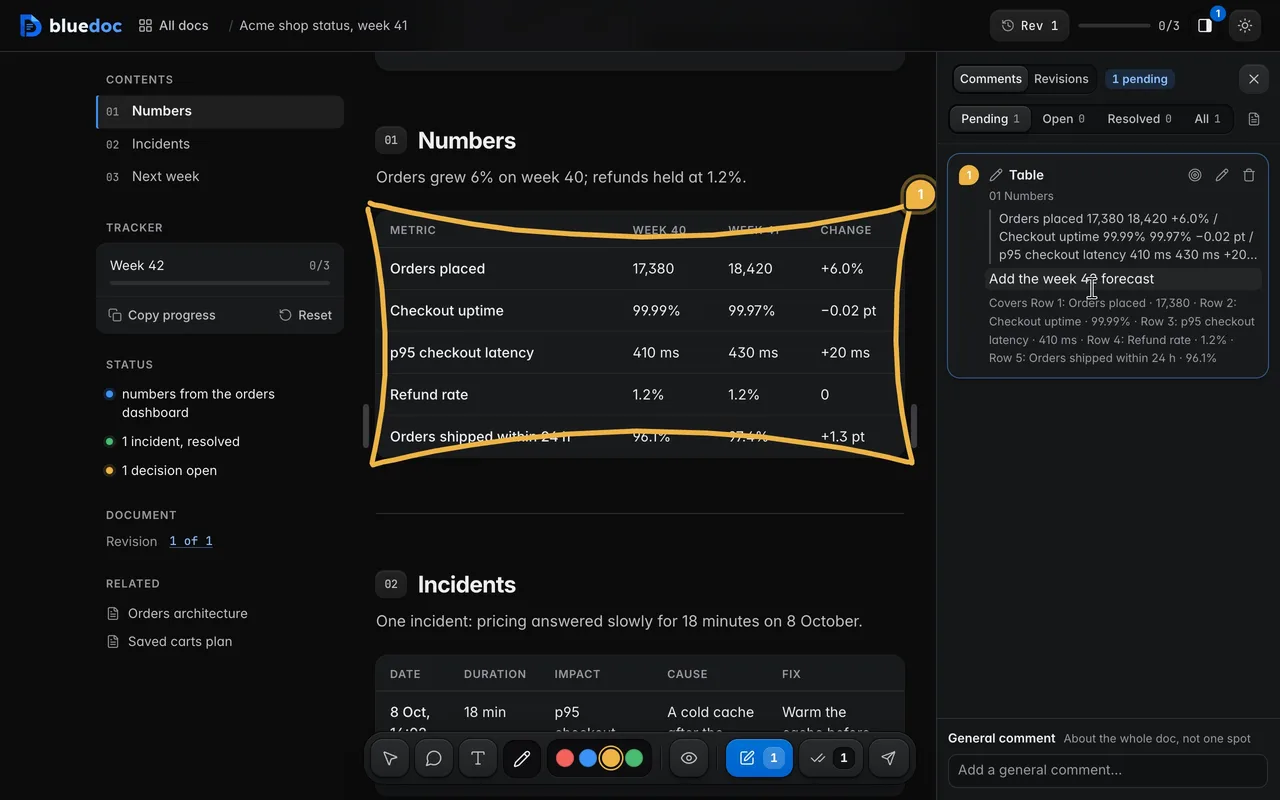
Draw around a part and comment on it
Pen (D) draws freehand in a colour from the pill above the dock; Region (M) drags a box. Box a table or a group of rows, and the note covers each part inside.
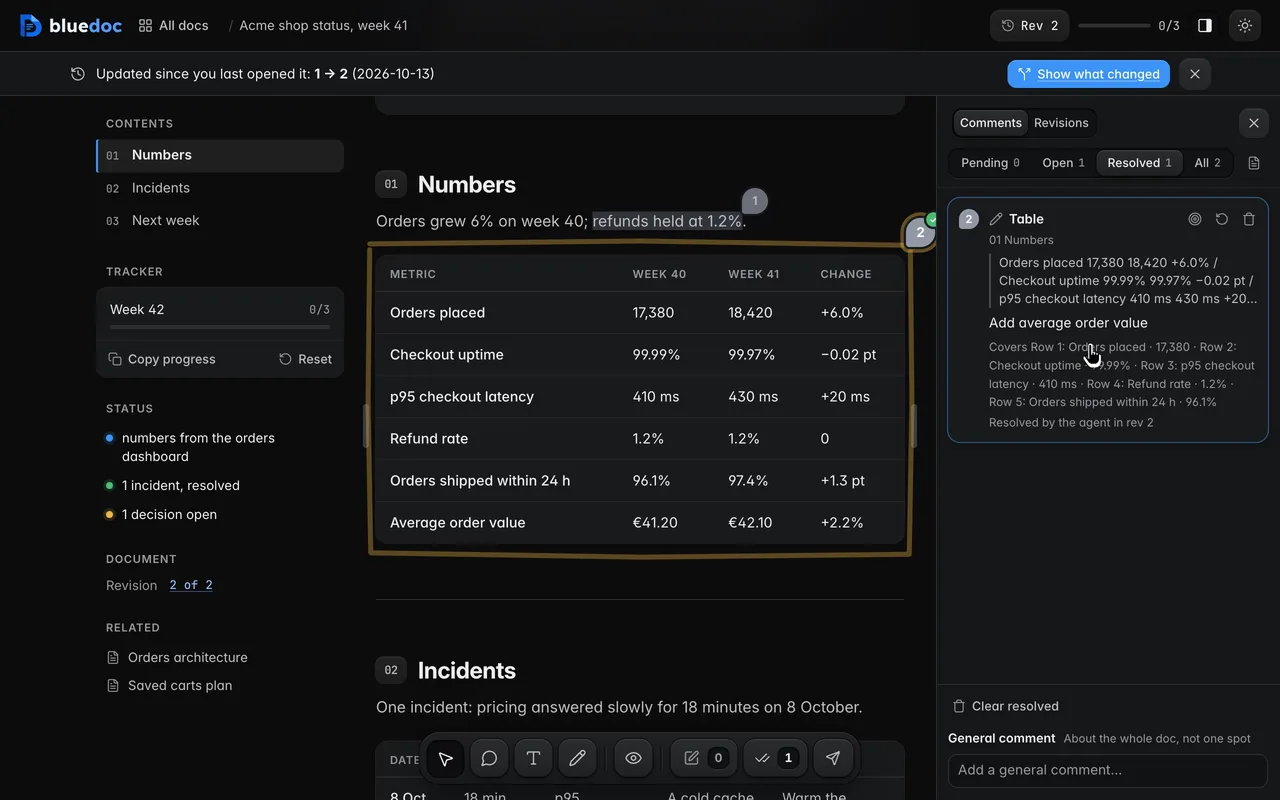
Follow a comment to Resolved
Notes go from Pending to Open when sent, and to Resolved when the agent’s revision says it dealt with them.
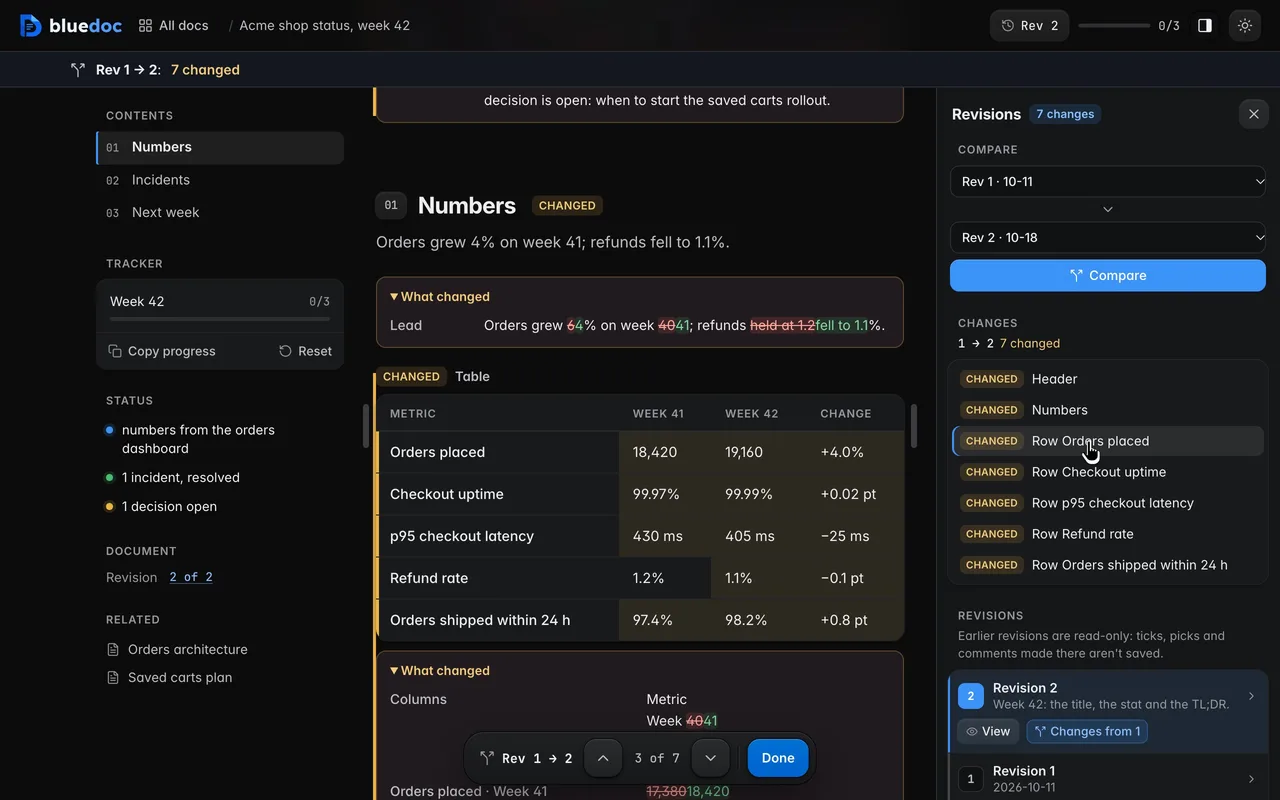
See what changed since last week
Next week’s update is a new revision of the same page. Compare the two and the title, the TL;DR and the table cells that moved are marked word by word.
How the agent writes a chart
Numbers in the JSON.
The page draws them.
Numbers go in a chart block: stat cards, lines and areas, bars side by side or stacked, ranked bars, a donut or progress rows. build.py schema chart prints the format.
python3 <skill>/scripts/build.py schema chartpython3 <skill>/scripts/build.py docs/status/week-41.bluedoc.json{ "type": "chart", "kind": "line", "title": "Orders per day", "unit": "orders", "x": ["Mon", "Tue", "Wed", "Thu", "Fri", "Sat", "Sun"], "series": [ { "id": "w41", "label": "Week 41", "values": [2510, 2630, 2702, 2588, 2790, 2810, 2390], "area": true }, { "id": "w40", "label": "Week 40", "values": [2440, 2480, 2530, 2470, 2650, 2660, 2150], "tone": "muted" } ], "caption": "Thursday's dip is the 18-minute pricing slowdown. Source: orders dashboard."}{ "type": "chart", "kind": "stat", "title": "Refund rate", "sub": "weeks 34 to 41", "x": ["Week 34", "Week 35", "Week 36", "Week 37", "Week 38", "Week 39", "Week 40", "Week 41"], "stats": [ { "label": "Refunds", "value": 1.2, "unit": "%", "delta": "0.0 pt", "good": "down", "spark": [1.4, 1.3, 1.3, 1.2, 1.3, 1.2, 1.2, 1.2] } ]}Colours come from ten theme tones, never hex. The build checks that every x label has one value and every number is finite.
Other features
Six more features, a page each.
- CommentsPin, box, select or draw a comment on any part of the page.
- QuestionsPick the starred answer, write your own, or ask for more.
- Send and approveApprove a revision, or send it back with your notes.
- RevisionsEvery revision kept, any two compared side by side.
- Share and exportA view-only bluedoc.ai link, or an HTML, PDF or Markdown file.
- Home and SettingsEvery doc on one page: search, filters, statistics and Settings.
Answer your agent
on a page.
Pick your agent. Each one installs the same skill from the GitHub repository.
claude plugin marketplace add andreiverdes/bluedocclaude plugin install bluedoc@bluedocInside a session the same commands are /plugin marketplace add andreiverdes/bluedoc and /plugin install bluedoc@bluedoc. Start a new session to load the skill.
codex plugin marketplace add andreiverdes/bluedoccodex plugin add bluedoc@bluedocRestart Codex. Mention the skill with $bluedoc or let Codex pick it from your request. Plan mode (/plan) opens the plan as a page; the README has the sandbox lines that skip the approval prompts.
pi install git:github.com/andreiverdes/bluedocRestart pi. /bluedoc-plan-mode turns on plan mode, and the plan opens as a page for your approval.
omp plugin marketplace add andreiverdes/bluedocomp plugin install bluedoc@bluedocRun /reload-plugins in an open session, or start a new one. omp’s plan reviews open as pages: Approve runs the plan, Request changes refines it.
copilot plugin install andreiverdes/bluedocStart a new session. When Copilot leaves plan mode, its plan opens as a page and waits for your approval.
git clone https://github.com/andreiverdes/bluedoc.gitagy plugin install bluedoc/antigravityRestart agy. In plan mode (agy --mode plan or /plan), the implementation plan opens as a page for your approval.
npx skills add andreiverdes/bluedocFor any other agent that reads skills. Or clone the repository and link skills/bluedoc into your agent’s skills folder.
- Python 3.9 or later on PATH
- git, for code reviews
- gh, only for GitHub review threads and Share