Charts drawn in the page
A chart block holds the numbers and the page draws them: stat cards, lines, bars, a donut and progress rows, in dark and light, with the values on hover.
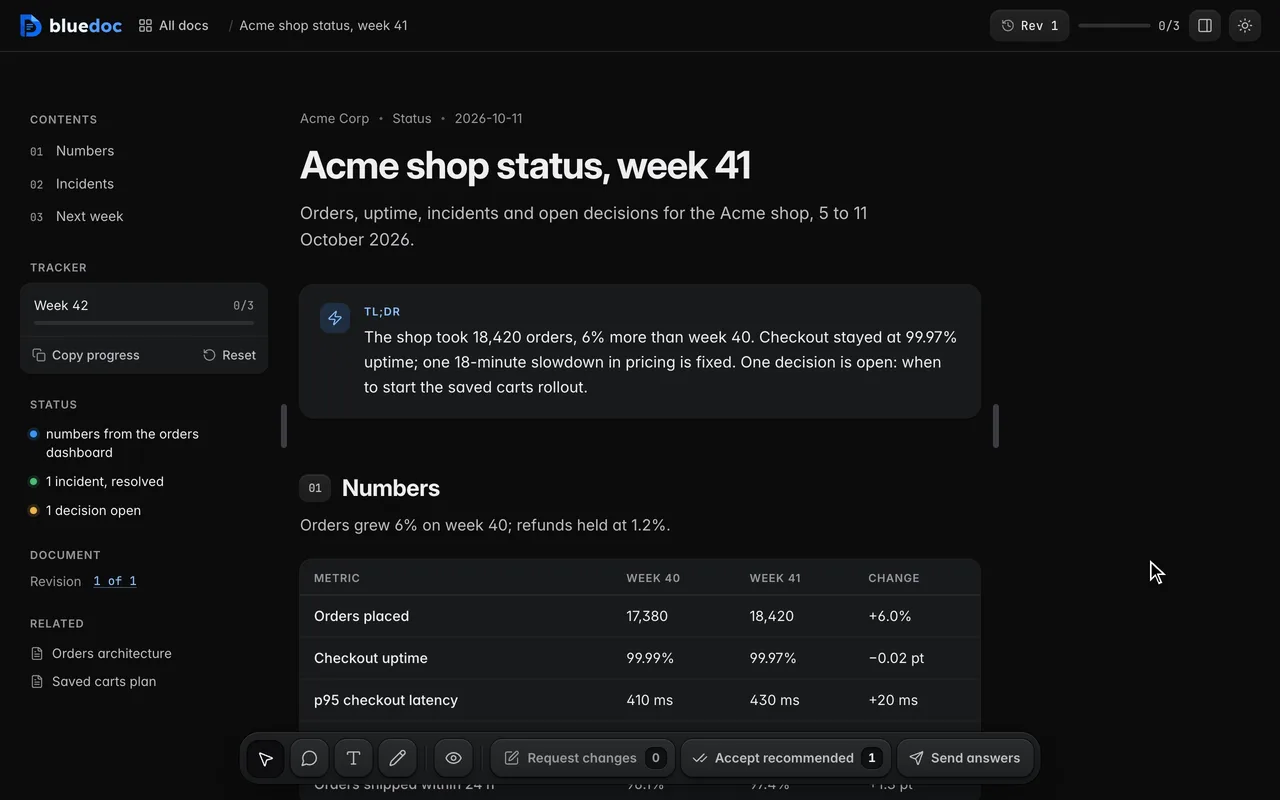
Status pages, incident reports and weekly numbers read better when you can see the shape of them. bluedoc now has a chart block: the agent writes the numbers into the doc, and the page draws them.
Six kinds
- Stat cards: the value and its unit, the change in a pill and a sparkline. The pill turns green when the change went the good way and red when it didn’t, and a chart can say that lower is better, as with latency.
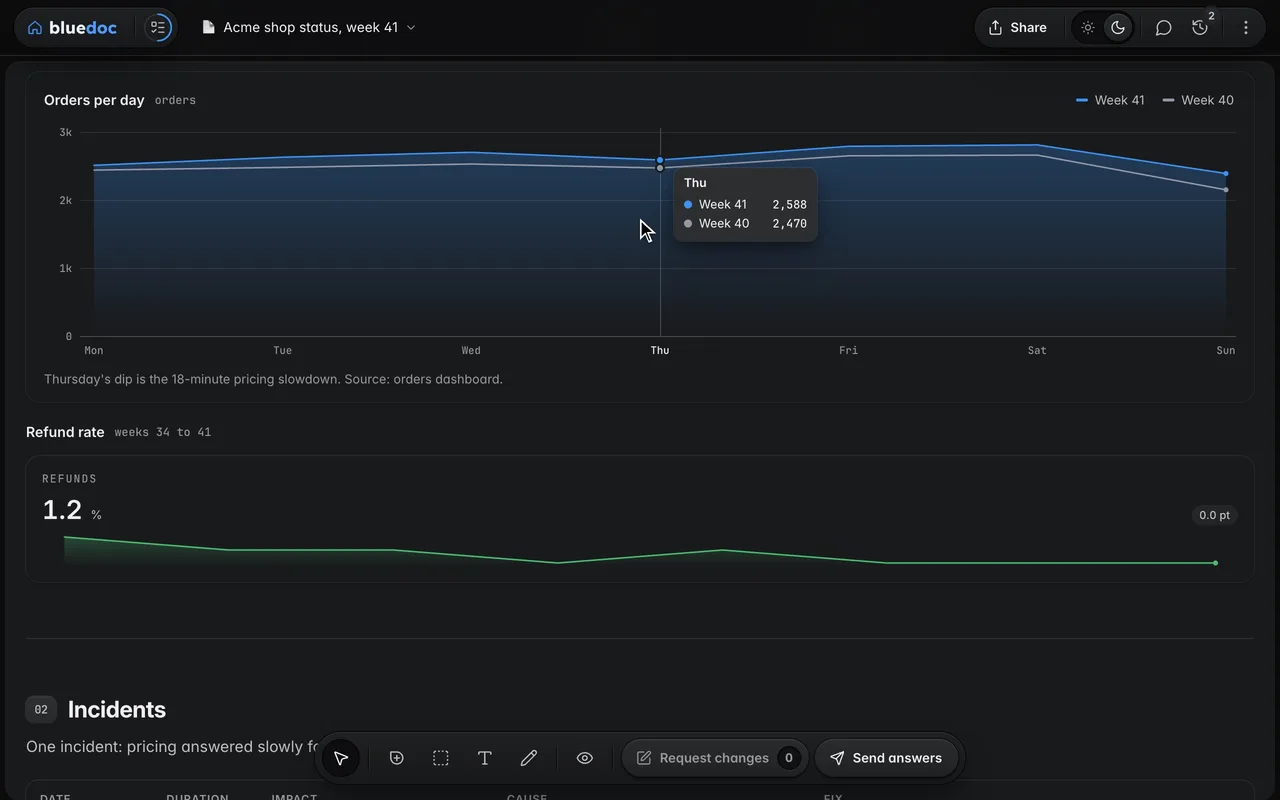
- Line and area: up to four series over a value axis with gridlines and a legend, with shading under a line when you want it.
- Bars: side by side or stacked; the tooltip adds the total.
- Ranked bars: horizontal, biggest first, with the value at each bar’s end.
- Donut: the parts round a ring with the total in the middle, and a legend with each part’s count and share.
- Progress rows: one row per item, how far along it is and the percent done. A row that reaches its goal turns green and reads Done.
Drawn in the page, dark and light
The page draws each chart itself, in HorizonUI’s look and the theme’s colours, and redraws it when you flip the ☀/☾ switch. There’s nothing to download, so a chart looks the same on a shared page, in an exported HTML file and on paper.
Hover a point to see its values, or focus the chart and use ← and →. The legend’s chips hide and show a series, and the axis follows. Every number is also in a table for screen readers and in the Markdown export. In the compare view a changed chart is marked Changed, with each value that moved.
The agent writes numbers, not pictures
A chart is never an image. It’s a block in the doc’s JSON, so the next revision can change a number and the compare view lists exactly which ones moved. This is the orders chart from the acme-status example:
{
  "type": "chart", "kind": "line",
  "title": "Orders per day", "unit": "orders",
  "x": ["Mon", "Tue", "Wed", "Thu", "Fri", "Sat", "Sun"],
  "series": [
    {
      "id": "w41", "label": "Week 41", "area": true,
      "values": [2510, 2630, 2702, 2588, 2790, 2810, 2390]
    },
    {
      "id": "w40", "label": "Week 40", "tone": "muted",
      "values": [2440, 2480, 2530, 2470, 2650, 2660, 2150]
    }
  ],
  "caption": "Thursday's dip is the 18-minute pricing slowdown."
}
Colours come from ten theme tones, never hex. build.py schema chart prints the format, and the build checks that every x label has one value and every number is finite; a wrong value names its field.
Next time you ask your agent for a status page, ask for charts too. Everything else that’s new is in the bluedoc 1.1 release notes.